產品

SurveyMonkey 能滿足各種使用案例和需求。歡迎探索我們的產品,瞭解 SurveyMonkey 能為您提供什麼協助。

使用領先全球的線上調查問卷服務,獲得以資料為導向的深入解析。

探索集合於單一強大平台上的核心功能和進階工具。

建立並自訂線上表單,以收集資訊並接受付款。

可與超過 100 款應用程式和外掛程式整合,讓您事半功倍。

量身打造的解決方案,滿足您所有的市場研究需求。

利用內建的 AI 打造更優質的調查問卷並快速獲得獨到見解。

範本

測量客戶對貴公司的滿意度和忠誠度。

瞭解如何讓客戶滿意,使他們成為您忠實的擁護者。

取得可化為實際行動的深入解析,改善使用者的體驗。

向潛在客戶、受邀人等對象收集聯絡資訊。

輕鬆收集並追蹤下一場活動的邀請回函。

瞭解出席者的期待,使下一場活動更成功。

發掘能提升員工參與度並改善績效的深入解析。

收集出席者的想法和意見,把下一場會議辦得更好。

運用同儕的想法和意見來協助員工提升績效。

打造更好的課程並改善教學方法。

瞭解學生對課程資料和教學狀況的評價。

瞭解客戶對您的新產品構想有何看法。

資源

使用調查問卷和調查資料的最佳實務

有關問卷調查、商務技巧及更多其他內容,都在我們的部落格。

SurveyMonkey 的使用教學與指南。

頂尖品牌如何透過 SurveyMonkey 推動成長。

聯絡銷售人員登入
聯絡銷售人員登入

Results Dashboard

Easily create and share dynamic survey dashboards with real-time results.

Dashboard results on computer monitor

Transform your survey results into a report your stakeholders will understand. With survey dashboards, you can highlight key takeaways and even add in your own notes or recommended next steps. You can create multiple dashboards for any single survey. Plus, your dashboards dynamically stay up-to-date and can be shared with anyone via a weblink.

By creating survey dashboards, you can easily surface the most important details for specific groups. Help your stakeholders see where and how to take action on your survey results.

Whether it’s for your boss, colleagues, or clients, easily personalize how you share results. Filter answer data, select which questions to show, drag-and-drop charts, and customize your layout.

Show your stakeholders only the information they want or need to see. Data will dynamically refresh as new results come in, so you don’t need to spend time updating static reports and presentations.

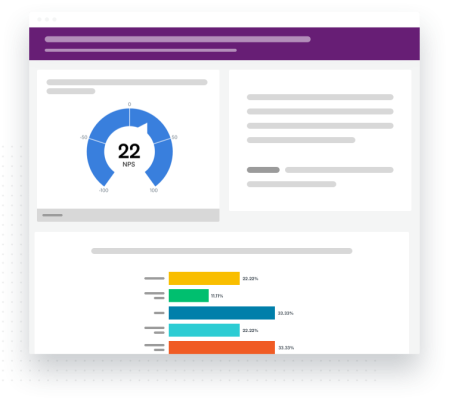
NPS dashboard

Want to monitor your Net Promoter Score®, identify its key drivers, and easily keep everyone informed along the way?

With Results Dashboards, you can:

  • Filter data by month or week, and then show charts side-by-side to easily compare scores over time
  • Add comments below or next to individual charts to flag changes or provide more context
  • Display what delights your customers and what drives their dissatisfaction
  • Customize charts and colors to personalize your dashboards
  • Share your recommendations—all backed up by data—with executives, managers, or even your own team

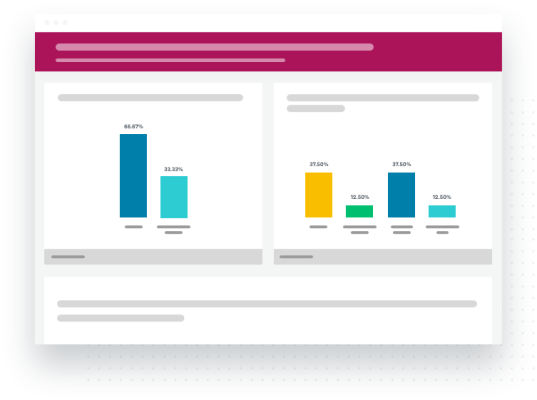
Only want to share some key findings with specific groups? Here’s how you could run a quarterly employee engagement survey across an organization and give each team actionable insights.

With Results Dashboards, you can:

  • Filter data by department, team, or business unit, and create individual dashboards for any group
  • Show stakeholders key points by including data on things like key attributes, such as job satisfaction
  • Tailor the look and feel of your dashboards with custom colors
  • Show how teams or departments compare to overall averages
  • Do a side-by-side comparison of results from different time periods to see trends and changes
Employee dashboard

Donna con capelli rossi che crea un'indagine su un laptop

探索我們專為特定角色或產業設計的眾多工具組,幫助您善加利用意見回饋。

Una donna e un uomo che leggono un articolo sul laptop e prendono appunti su foglietti adesivi

在離職面談中詢問合適的問題,以減少員工流失。立即開始使用我們的員工表單建立器工具和範本。

Uomo sorridente con occhiali che usa un laptop

透過自訂同意表單,取得所需的權限。立即免費註冊,開始使用我們的同意表單範本建立表單。

Donna che esamina informazioni sul suo laptop

輕鬆建立和自訂專屬的請求表單,以收集員工、客戶及其他對象的要求或申請。使用專家建立的範本,幾分鐘就能完成。