產品

SurveyMonkey 能滿足各種使用案例和需求。歡迎探索我們的產品,瞭解 SurveyMonkey 能為您提供什麼協助。

從全球首屈一指的線上調查問卷中,獲取以資料為導向的深入分析。

可與超過 100 款應用程式和外掛程式整合,讓您事半功倍。

建立並自訂線上表單,以收集資訊和付款方式。

利用內建的 AI 打造更優質的調查問卷並快速獲得獨到見解。

依實際需求量身打造解決方案,滿足您所有的市場研究需求。

範本

測量客戶對貴公司的滿意度和忠誠度。

瞭解如何讓客戶滿意,使他們成為您忠實的擁護者。

取得可化為實際行動的深入解析,以改善使用者的體驗。

向潛在客戶、受邀人等對象收集聯絡資訊。

輕鬆收集並追蹤活動邀請回函。

瞭解參加者的需要,使下一場活動更成功。

發掘能提升員工參與度並改善績效的深入解析。

瞭解與會者的想法和意見,把下一場會議辦得更好。

運用同儕意見回饋來協助員工改善績效。

打造更好的課程並改善教學方法。

瞭解學生對課程資料和教學狀況的評價。

瞭解客戶對您的新產品構想有何看法。

相關資源

使用調查問卷和調查資料的最佳實務

有關問卷調查、給企業的訣竅及其他主題的內容,都在我們的部落格。

SurveyMonkey 的使用教學與指南。

頂尖品牌如何透過 SurveyMonkey 推動成長。

聯絡銷售人員登入
聯絡銷售人員登入
SurveyMonkey and Tableau logos

Get better insights with a 360 view of your data.

  • Capture insights from your surveys at scale in real time
  • Get a 360 view by combining operational data with feedback data 
  • Set up a sync from any survey to automatically add new responses into Tableau over time
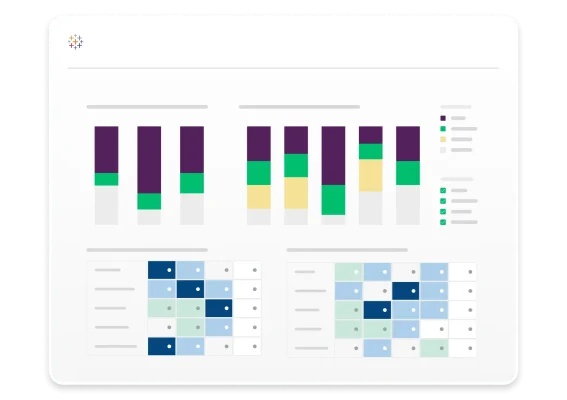
Tableau and SurveyMonkey graph example
  • Use the full force of Tableau’s advanced capabilities to analyze data
  • Compare feedback over time and discover patterns and trends
  • Segment data by desired attributes such as customer spend to identify correlations
  • Create beautiful, presentation-ready visualizations and interactive dashboards
  • Share insights with key stakeholders in a standardized way
  • Drive smarter decisions through enriched and holistic insights
Tableau and SurveyMonkey graph example

From data on the US presidential election, to COVID-19 concerns, SurveyMonkey and Tableau collect and visualize millions of data points in real time.

quote-tableau-integration

“The marriage of SurveyMonkey and Tableau increases our team’s efficiency and ability to collaborate, and that provides real-time value to our agency and in turn, our clients.”

Neil Owen,
Executive Vice President
Ntara